
 خبری دربارهی دوجکوین (DOGE)
Dogecoin price prediction 2026-2032: DOGE to the moon?
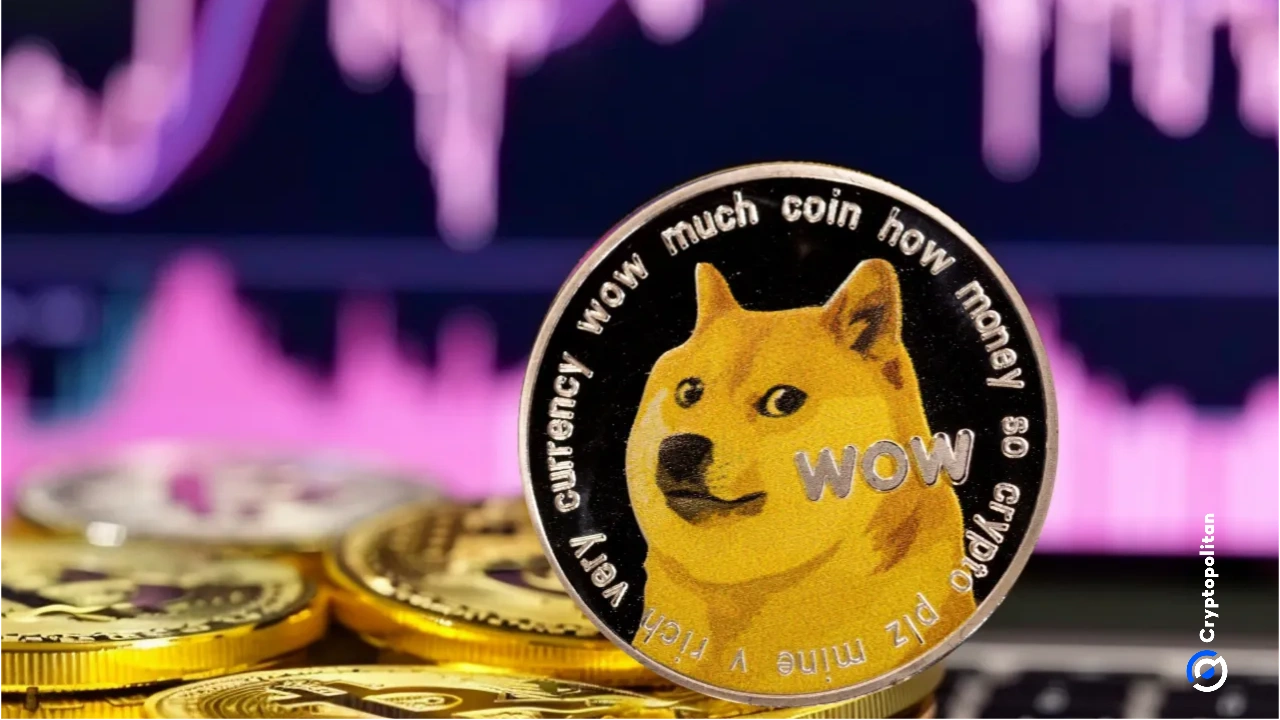
Key takeaways: DOGE price may reach $0.135 by the end of 2026. By 2028, DOGE may potentially achieve a peak price of $0.220. By 2032, DOGE might touch $0.461 with an average trading price of $0.437. Propelled by a dedicated community of part-time developers and enthusiastic internet supporters, Dogecoin is poised for significant growth in the coming years. Despite relying on borrowed code due to limited resources, its popularity continues to soar, with tens of thousands of social media followers advocating for supply limitations. However, the Dogecoin ecosystem is expected to develop and expand over time. Having touched its ATH at $0.7376, will DOGE reach $1? Let’s get into the Dogecoin price prediction and technical analysis. Overview Cryptocurrency Dogecoin Token DOGE Price $0.0684 (-3.88%) Market Cap $10.7B Trading Volume (24-hour) $687.69M Circulating Supply 156.67B DOGE All-time High $0.7316 May 08, 2021 All-time Low $0.00008547 May 07, 2015 24-hour High $0.07154 24-hour Low $0.06804 Dogecoin price prediction: Technical analysis Volatility 5.13% Price Prediction $0.08257 (18.79%) Fear & Greed Index 28 (Fear) Sentiment Bearish Green Days 14/30 (47%) 50-Day SMA $0.08479 200-Day SMA $0.08555 Dogecoin price analysis TL;DR Breakdown: Dogecoin price analysis shows a bearish daily trend with the price heading toward $0.0684. The coin reports 3.88% losses in its value for the past 24 hours. The DOGE coin faces immediate resistance around the $0.0723 level. As of November 9, 2026, Dogecoin’s price analysis indicates a bearish trend as the coin gains again after a price appreciation. The memecoin has plunged to $0.0684 after dipping to $0.0689 yesterday, remaining down 3.88% over the last 24 hours. Selling pressure continues to linger, as the broader picture still remains bearish. Dogecoin 1-day price chart analysis The one-day chart for Dogecoin indicates that the coin continues to shed as selling pressure lingers, with losses over the past day widening. The memecoin’s price decreased to $0.0684 today, with a fresh red candlestick signaling presence of bearish elements. The immediate resistance for Dogecoin is also present at the $0.0723 level, followed by another resistance at $0.0769. DOGE/USD 1-day price chart. Source: TradingView The distance between the Bollinger Bands defines the intensity of volatility. This distance is wide, leading to comparatively high volatility levels. Moreover, the upper limit of the Bollinger Bands indicator, indicating a resistance level, has shifted to $0.0824, whereas its lower limit, indicating a broken support, has moved to $0.0685. Multiple technical quantitative indicators are bearish, and the Relative Strength Index (RSI) indicator is trending in the oversold region. The indicator’s curve has reached 29 in the past 24 hours. As the indicator moves downwards, it hints at the presence of selling pressure, as market conditions turn unfavorable.
عنوان اصلی (انگلیسی): Dogecoin price prediction 2026-2032: DOGE to the moon?
مشاهدهی خبر کامل در منبع ↗ بازگشت به دوجکویناین خلاصه بهصورت خودکار از کوینمارکتکپ ترجمه شده و ممکن است خطای ماشینی داشته باشد؛ صرفاً جهت اطلاعرسانی است و توصیهی معاملاتی نیست.